一、Promethus简介
Prometheus是一个开源的系统监控和报警系统,现在已经加入到CNCF基金会,成为继k8s之后第二个在CNCF托管的项目,在kubernetes容器管理系统中,通常会搭配prometheus进行监控,同时也支持多种exporter采集数据,还支持pushgateway进行数据上报,Prometheus性能足够支撑上万台规模的集群。
Prometheus是由SoundCloud开发的开源监控报警系统和时序列数据库(TSDB)。Prometheus使用Go语言开发,是Google BorgMon监控系统的开源版本。
二、Prometheus生态架构图
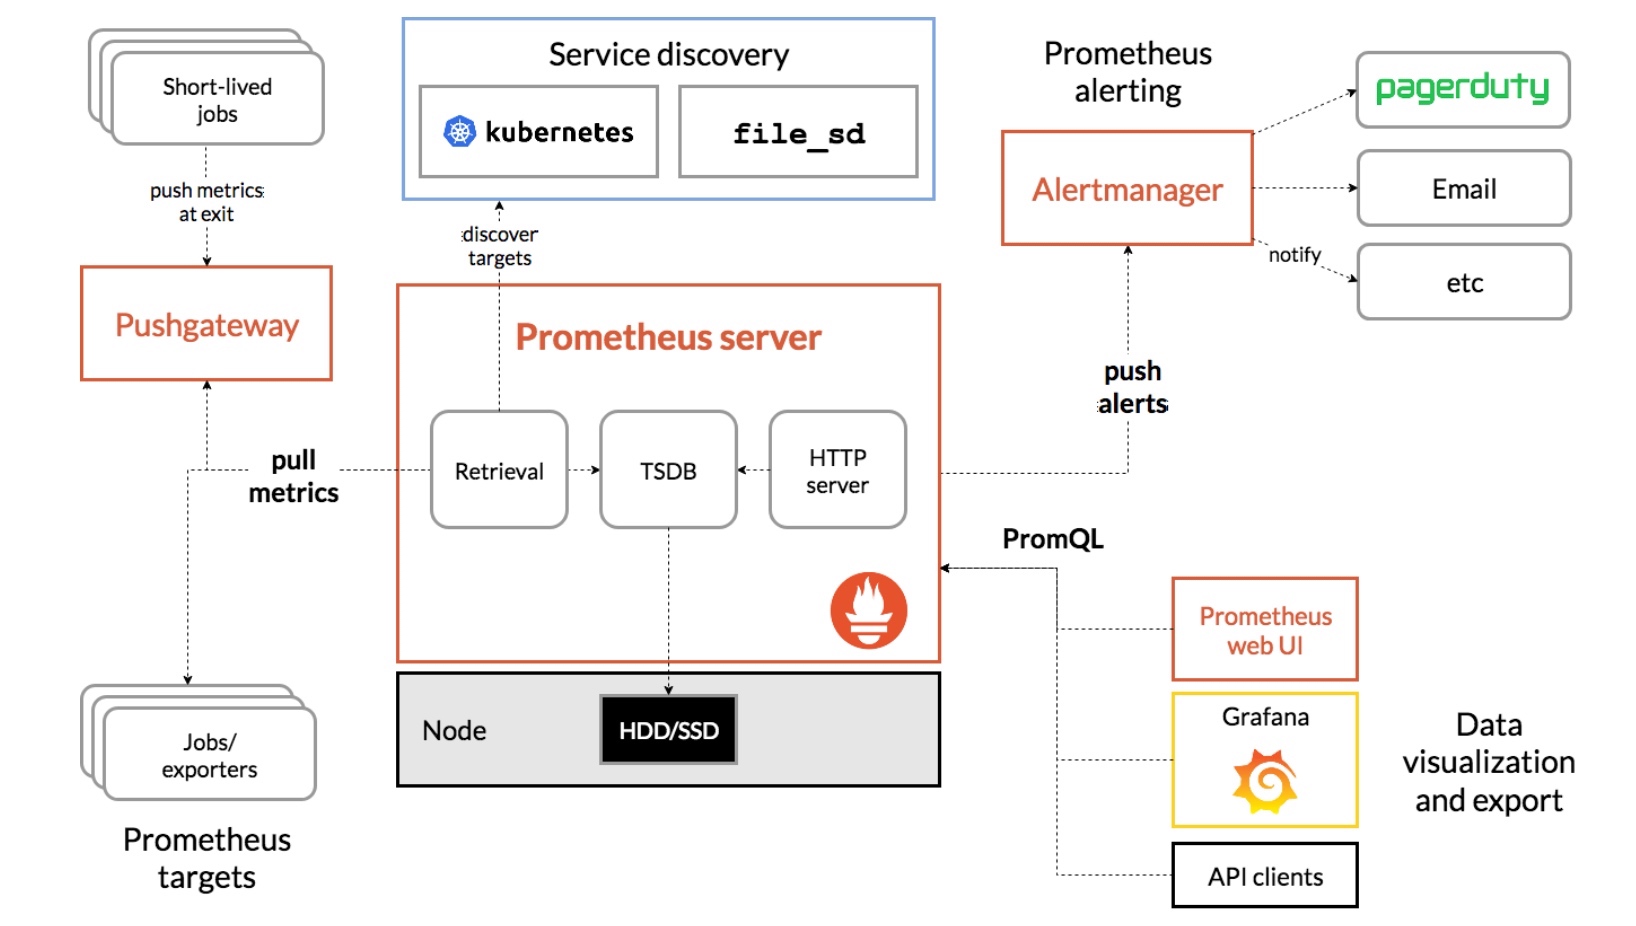
- Prometheus Server: 主要负责数据采集和存储,提供PromQL查询语言的支持.
- Push Gateway: 支持临时性Job主动推送指标的中间网关。
- Alertmanager: 警告管理器,用来进行报警。
三、Promethus部署
3.1 部署方式
通常在k8s中部署prometheus监控可以采取的方法有以下:
- yaml 部署
- operator部署
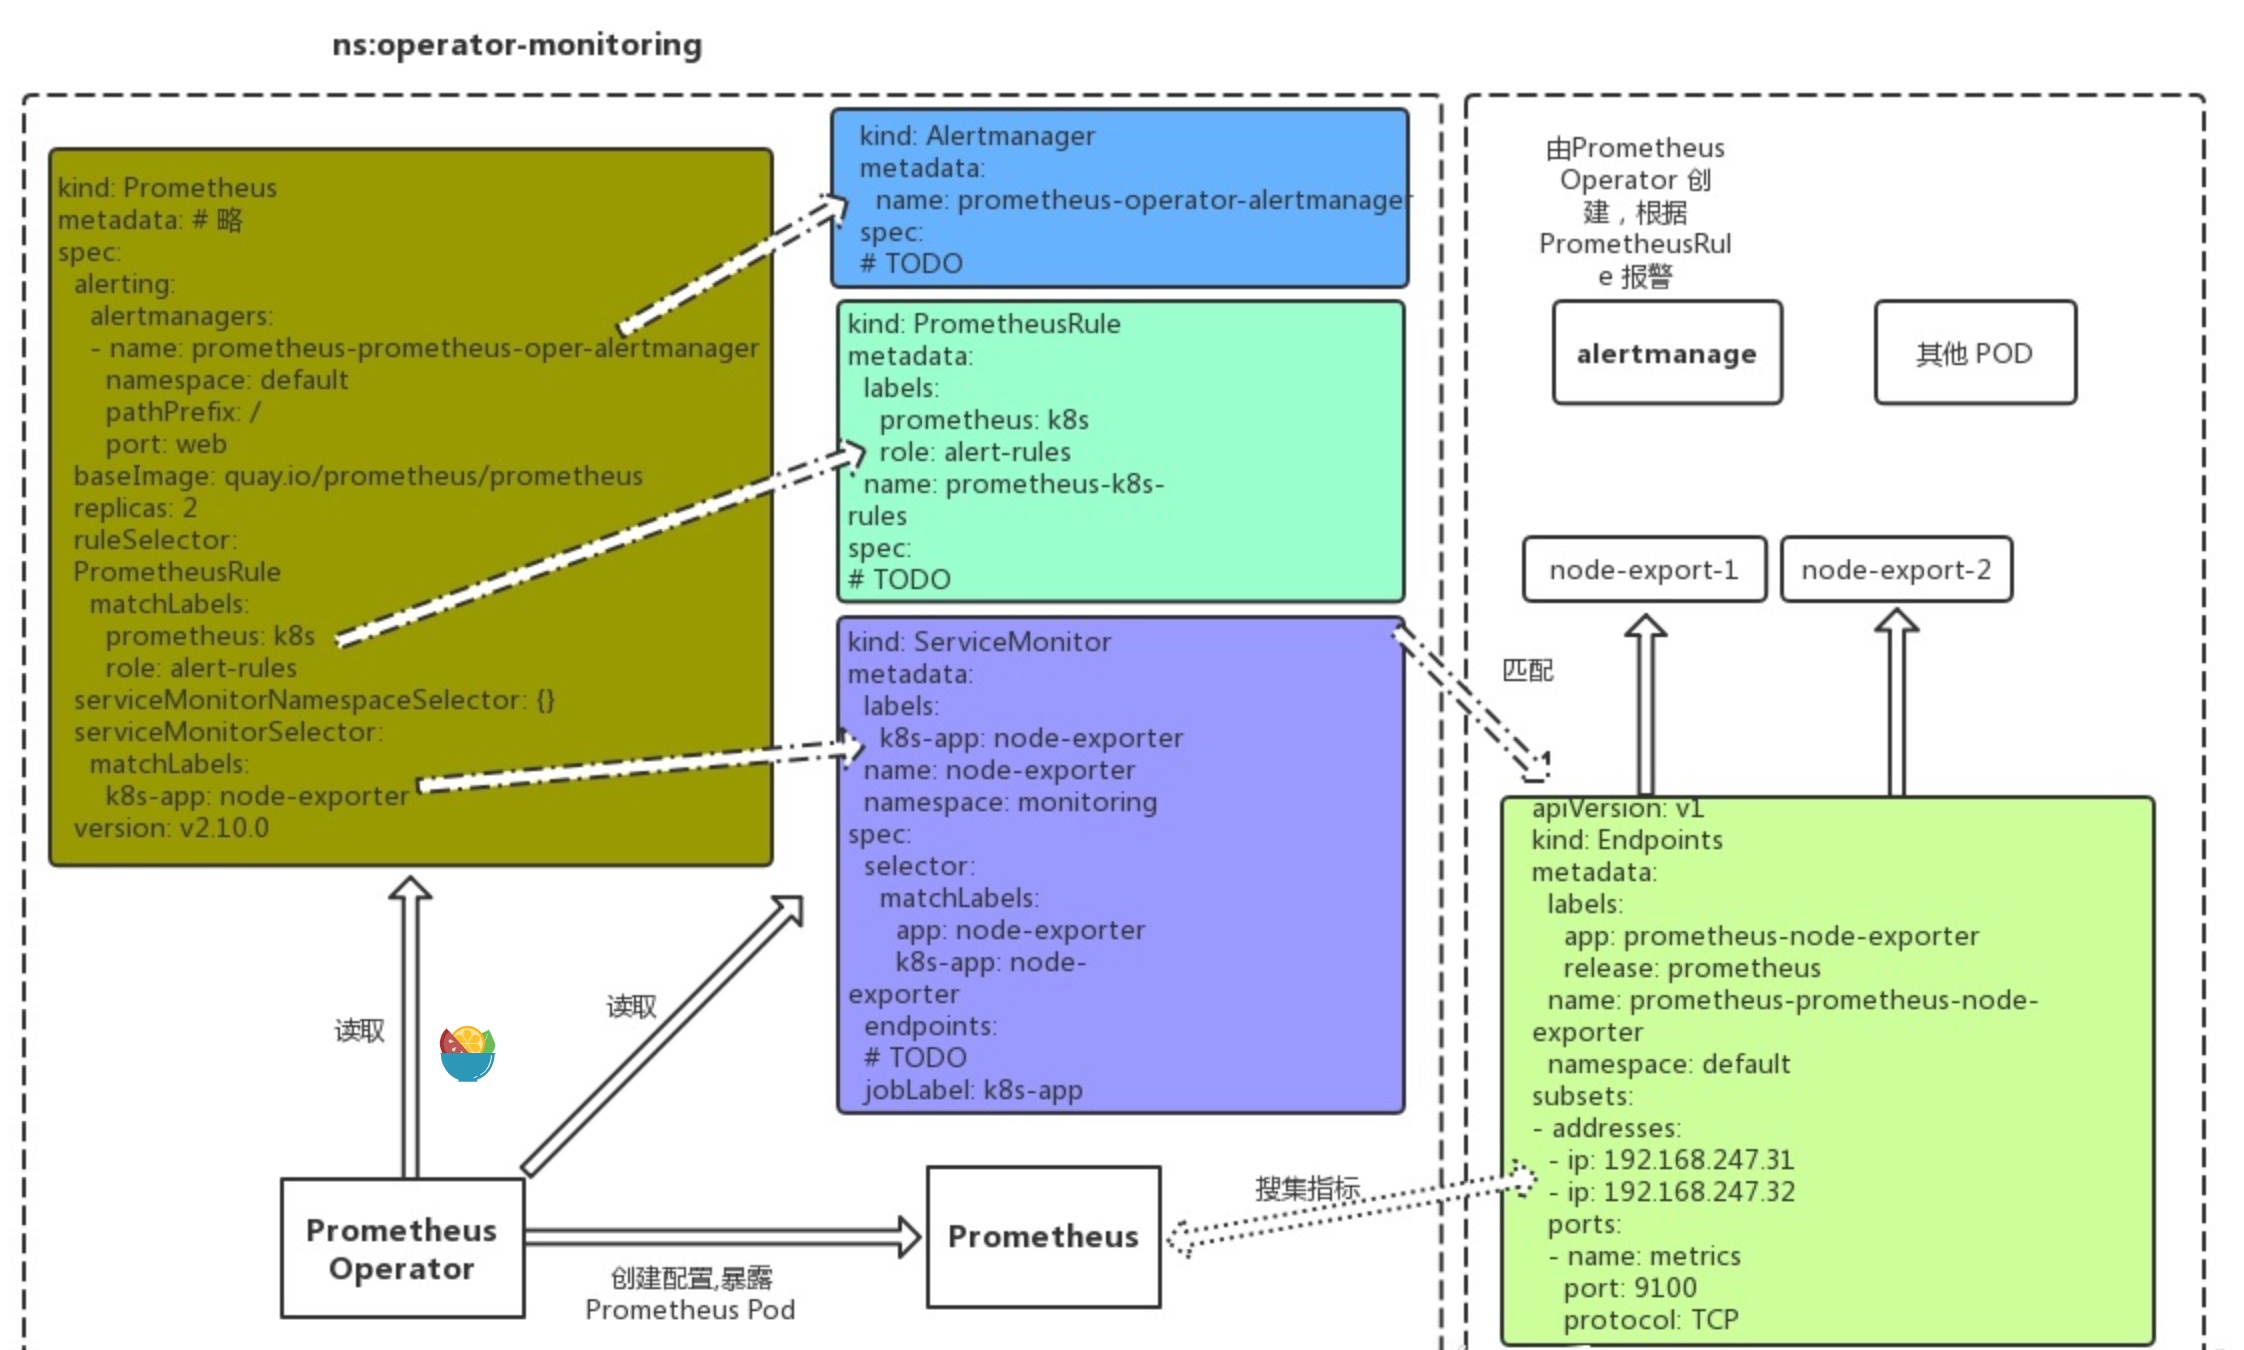
3.2 Prometheus Operator
Prometheus Operator的本职就是一组用户自定义的CRD资源以及Controller的实现,Prometheus Operator负责监听这些自定义资源的变化,并且根据这些资源的定义自动化的完成如Prometheus Server自身以及配置的自动化管理工作。以下是Prometheus Operator的架构图:

3.3 Prometheus-operator CRD
Prometheus Operater 定义了自定义资源:
- Prometheus
- ServiceMonitor
- Alertmanager
- PrometheusRule
- ...
3.3.1 Prometheus
由 Operator 依据一个自定义资源kind: Prometheus类型中,所描述的内容而部署的 Prometheus Server 集群,可以将这个自定义资源看作是一种特别用来管理Prometheus Server的StatefulSets资源。
每一个 Prometheus 资源,Operator 都会在相同 namespace 下部署成一个正确配置的 StatefulSet,Prometheus 的 Pod 都会挂载一个名为
3.3.2 ServiceMonitor
一个Kubernetes自定义资源(和kind: Prometheus一样是CRD),该资源描述了Prometheus Server的Target列表,Operator 会监听这个资源的变化来动态的更新Prometheus Server的Scrape targets并让prometheus server去reload配置(prometheus有对应reload的http接口/-/reload)。而该资源主要通过Selector来依据 Labels 选取对应的Service的endpoints,并让 Prometheus Server 通过 Service 进行拉取(拉)指标资料(也就是metrics信息),metrics信息要在http的url输出符合metrics格式的信息,ServiceMonitor也可以定义目标的metrics的url.
要想使用 Prometheus Operator 监控 Kubernetes 集群中的应用,Endpoints 对象必须存在。Endpoints 对象本质是一个 IP 地址列表。通常,Endpoints 对象由 Service 构建。Service 对象通过对象选择器发现 Pod 并将它们添加到 Endpoints 对象中。
一个 Service 可以公开一个或多个服务端口,通常情况下,这些端口由指向一个 Pod 的多个 Endpoints 支持。这也反映在各自的 Endpoints 对象中。
Prometheus Operator 引入 ServiceMonitor 对象,它发现 Endpoints 对象并配置 Prometheus 去监控这些 Pods。
ServiceMonitorSpec 的 endpoints 部分用于配置需要收集 metrics 的 Endpoints 的端口和其他参数。在一些用例中会直接监控不在服务 endpoints 中的 pods 的端口。因此,在 endpoints 部分指定 endpoint 时,请严格使用,不要混淆。
注意:endpoints(小写)是 ServiceMonitor CRD 中的一个字段,而 Endpoints(大写)是 Kubernetes 资源类型。
ServiceMonitor 和发现的目标可能来自任何 namespace。这对于跨 namespace 的监控十分重要,比如 meta-monitoring。使用 PrometheusSpec 下 ServiceMonitorNamespaceSelector, 通过各自 Prometheus server 限制 ServiceMonitors 作用 namespece。使用 ServiceMonitorSpec 下的 namespaceSelector 可以现在允许发现 Endpoints 对象的命名空间。要发现所有命名空间下的目标,namespaceSelector 必须为空。
3.3.3 Alertmanager
Prometheus Operator 不只是提供 Prometheus Server 管理与部署,也包含了 AlertManager,并且一样通过一个 kind: Alertmanager 自定义资源来描述信息,再由 Operator 依据描述内容部署 Alertmanager 集群。
每一个 Alertmanager 资源,Operator 都会在相同 namespace 下部署成一个正确配置的 StatefulSet。Alertmanager pods 配置挂载一个名为
当有两个或更多配置的副本时,Operator 可以高可用性模式运行Alertmanager实例。
3.3.4 PrometheusRule
对于Prometheus而言,在原生的管理方式上,我们需要手动创建Prometheus的告警文件,并且通过在Prometheus配置中声明式的加载。而在Prometheus Operator模式中,告警规则也编程一个通过Kubernetes API 声明式创建的一个资源.告警规则创建成功后,通过在Prometheus中使用想servicemonitor那样用ruleSelector通过label匹配选择需要关联的PrometheusRule即可。
3.4 使用Helm chart形势部署Prometheus
3.4.1 helm charts地址
https://github.com/prometheus-operator/prometheus-operator
3.4.1 部署
helm repo add prometheus-community https://prometheus-community.github.io/helm-charts

helm repo update

helm search repo prometheus-community

helm pull prometheus-community/prometheus-operator --version 8.15.3

helm install prometheus prometheus-operator-8.15.3.tgz
4、Prometheus K8S 服务发现(基于opeartor实现)
4.1 通过annotations发现
ServiceMonitor 是实现K8S服务发现的一种形式,通过Prometheus-operator监听 ServiceMonitor或PodMonitor,从而生成对应的Prometheus配置文件,进而增加Prometheus的Target。但仍可通过Kubernetes annotations或其他Kubernetes 资源字段的模式增加Prometheus Target的模式。见下文出链接:
https://github.com/prometheus-operator/prometheus-operator/blob/main/Documentation/additional-scrape-config.md
4.2 示例
这里我们来看下Prometheus-operator方式如何实现通过部署物的Service进行服务发现
# 增加Prometheus配置文件prometheus-additional.yaml
# kubectl create secret generic promethues-octopus --from-file=prometheus-additional.yaml --dry-run -oyaml > promethues-octopus.yaml
# 修改Prometheus-operator Prometheus CO增加:
#spec:
  additionalScrapeConfigs:
    key: prometheus-additional.yaml
    name: promethues-octopus

# prometheus-additional.yaml内容如下:
- job_name: promethues-octopus
  kubernetes_sd_configs:
  - role: endpoints
  relabel_configs:
  - action: keep
    regex: true
    source_labels:
    - __meta_kubernetes_service_annotation_prometheus_io_octopus_scrape
  - action: replace
    regex: (.+)
    source_labels:
    - __meta_kubernetes_service_annotation_prometheus_io_path
    target_label: __metrics_path__
  - action: replace
    regex: ([^:]+)(?::\d+)?;(\d+)
    replacement: $1:$2
    source_labels:
    - __address__
    - __meta_kubernetes_service_annotation_prometheus_io_port
    target_label: __address__
  - action: labelmap
    regex: __meta_kubernetes_service_label_(.+)
# 更多配置见:
 https://www.orchome.com/9884
 https://prometheus.io/docs/prometheus/latest/configuration/configuration/#kubernetes_sd_config
4.2通过ServiceMonitor发现
kind: ServiceMonitor
apiVersion: monitoring.coreos.com/v1
metadata:
  generation: 1
  labels:
    app: prometheus-operator-node-exporter
    app.kubernetes.io/managed-by: Helm
    chart: prometheus-operator-9.3.2
  name: prometheus-prometheus-oper-node-exporter
  namespace: default
spec:
  endpoints:
    - port: metrics
  jobLabel: jobLabel
  selector:
    matchLabels:
      app: prometheus-node-exporter
      release: prometheus
# 配置参见:https://github.com/prometheus-operator/prometheus-operator/blob/main/Documentation/design.md#servicemonitor